The Atlas of Laudato Si’

Care for our common home begins where you are.

Laudato Si’ asks us to hear the cry of the earth and the cry of the poor together. From your neighborhood to the edges of continents, the Atlas of Laudato Si’ helps you see what is happening in the places you love — and choose how to respond.

The Atlas of Laudato Si’

Every place has a story. Start with yours.

Choose a place. Explore what is happening there. See ecological conditions, Laudato Si’ connections, and community action on the same map.

The Atlas of Laudato Si’

Opening the Atlas of Laudato Si’…

Map not loading or too small on your screen? Open the Atlas of Laudato Si’ in a new tab

Ways to read the Atlas of Laudato Si’

The map gives you information. These six questions can help you decide what to notice, investigate and bring back to your community.

These aren’t automated map tools. They’re prompts to help you think more carefully as you explore the Atlas.

Six ways of seeing · drag or use the arrows

NOTICE Where do you see the biggest change, gap, or concentration?

Start with what is actually visible. Look for places where a trend or status becomes stronger, weaker, denser, or suddenly different.

Try this view in the Atlas
Try it
Turn on a forest-cover layer around your community. Do you see an area where tree cover drops sharply?
Possible next step
Flag that area for local review before deciding whether restoration, protection, or another response makes sense.
Data layers

A place is more than what you can see.

The Atlas of Laudato Si’ brings together many kinds of environmental, social and ecclesial data to help reveal the different realities that shape a place. The themes below offer just a few examples of the many datasets you can explore across the map. Use them to discover what different layers can help you understand, how they connect to the Laudato Si’ Goals, and where one issue begins to intersect with another.

What this layer can show

People move for many reasons, and maps should never reduce migration to a single environmental cause. Population, displacement, climate exposure, conflict, livelihoods and infrastructure data can instead help us ask where pressures may be overlapping and where communities are especially vulnerable. A family leaving a drought-affected rural area in East Africa may face very different circumstances from people displaced by storms in the Philippines or economic insecurity in a Latin American city.

Laudato Si’ connections: Response to the Cry of the Poor · Community Resilience and Empowerment · Ecological Economics

What this layer can show

What communities throw away can tell us something about how resources move through everyday life. Waste-generation, landfill, plastics and material-consumption data can help reveal where consumption is concentrated, where disposal systems are under pressure, and where environmental burdens fall unevenly. A wealthy urban district may generate large amounts of packaging waste, while communities near an informal dumpsite may bear the health and environmental consequences.

Laudato Si’ connections: Adoption of Sustainable Lifestyles · Ecological Economics · Response to the Cry of the Earth · Response to the Cry of the Poor

What this layer can show

Land-cover data help us see how forests, farms, grasslands, wetlands and built areas change over time. Satellite observations and agricultural datasets can reveal patterns that are difficult to perceive from the ground alone. Expanding agriculture, urban growth, habitat loss or land restoration can each reshape the relationship between food systems, ecosystems and local livelihoods.

Laudato Si’ connections: Response to the Cry of the Earth · Ecological Economics · Response to the Cry of the Poor · Adoption of Sustainable Lifestyles

01 / 09

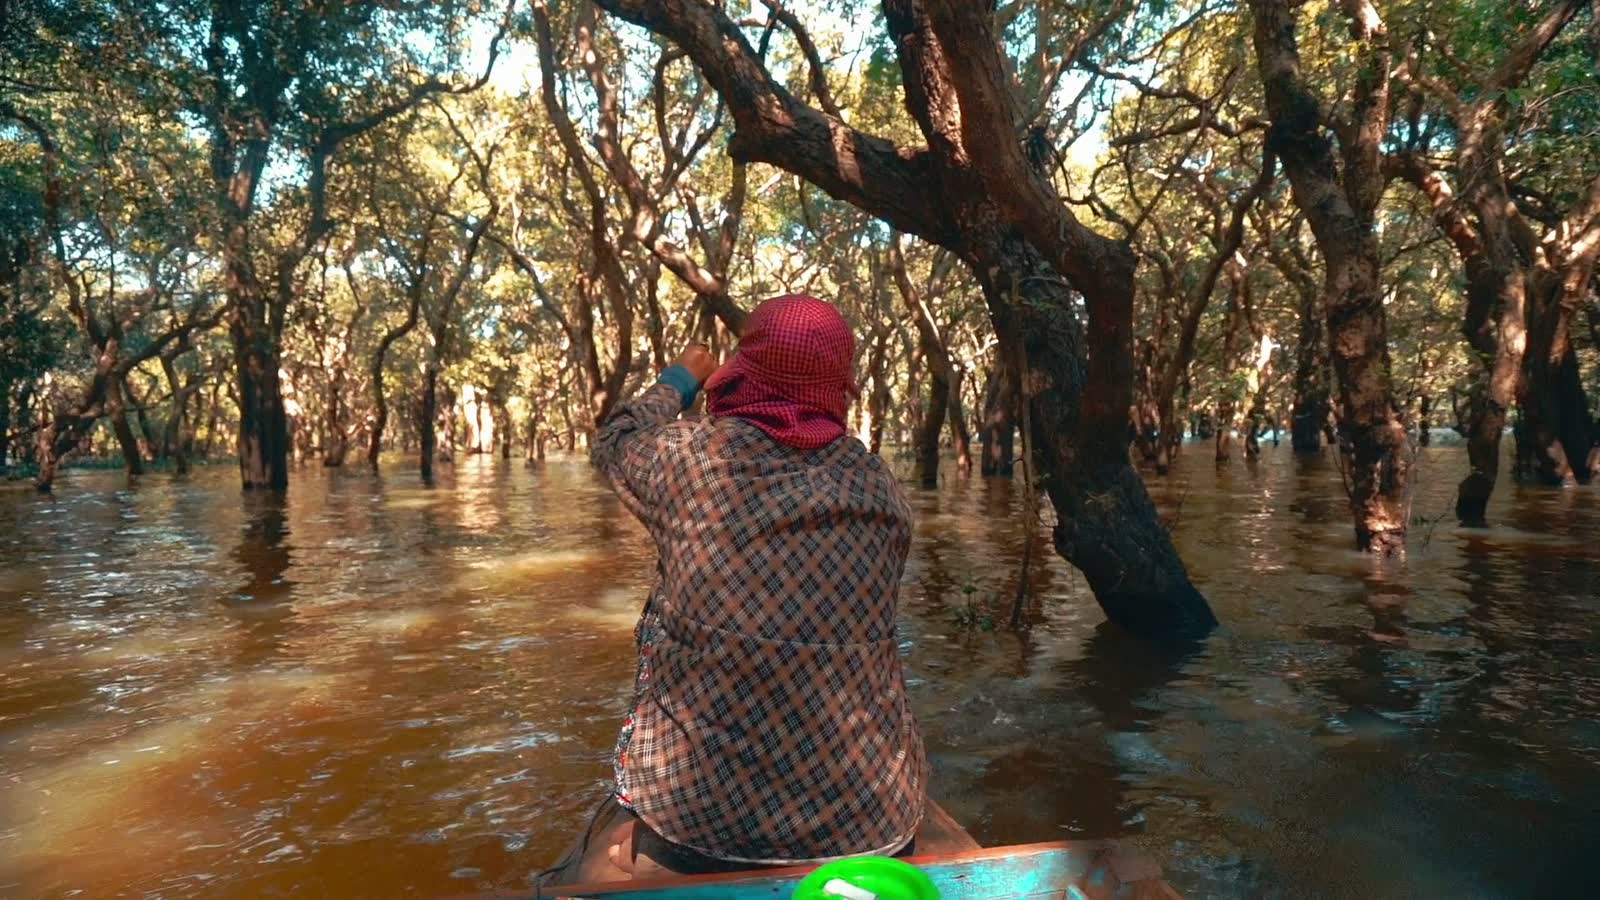
Photographs are a way into each subject, not proof that a mapped condition exists at the pictured location.

Stewardship & evidence

What’s behind the map?

A map is only as useful as the data — and the care — behind it.

Each layer is documented so you can understand where the information came from, when it was produced, how precise it is, and what it can reasonably tell you. Some layers describe global environmental patterns; others reflect local places, Church geographies, or Laudato Si’ Action Platform participation. They should not all be read in the same way.

01

Traceable sources

Every published layer points back to its source: who created it, what it measures, and when it was last updated. Sources may include scientific institutions, public datasets, Church records, and Laudato Si’ Action Platform participant information.

02

Methods and limits

A dataset can show a pattern without explaining its cause. We make the method and limitations visible so you can distinguish what the evidence shows, what it suggests, and what it cannot establish on its own.

03

Scale matters

Not every dot, line, or shaded area has the same precision. A global estimate is different from a local measurement; a diocesan boundary is different from a street or property line. Zooming in does not make the underlying data more precise.

04

Data with responsibility

Some information should not be mapped at full precision. Sensitive locations may be generalized, and community-contributed data should be used with consent, appropriate attribution, and respect for the people and places it represents. The GeoHub is designed around stewardship as well as access.

Questions about the Atlas of Laudato Si’ and the Laudato Si’ Action Platform

The Atlas is designed to help you explore a place with curiosity and care. These answers explain what the map can tell you, what it cannot, and how to use it responsibly.

No. A layer showing emissions, heat, water stress, biodiversity or another condition describes what the selected dataset shows within or around that geographic area. It does not mean the diocese, parish, school or Laudato Si’ Action Platform participant caused that condition or is responsible for it.

Put your community
on the map.

The Atlas grows as institutions join the Laudato Si’ Action Platform, keep their information current, and record the actions they are taking. Make your community visible, learn from others, and contribute to a fuller picture of the Church responding to our common home.

Is something missing or misplaced? Contact info@laudatosiactionplatform.org